
data visualization
'data visualization' is a highly searched keyword with 49,500 average monthly searches. It has relatively low competition on Etsy with only 1,384 listings targeting the keyword. Search interest dropped 33% between October 2025 and September 2026, so standing out with strong listings matters more than ever. With a keyword difficulty of 12/100, 'data visualization' is relatively easy to rank for because search volume is high while competition is low. Products in this category typically sell between $2.25 and $225, with most priced around $20. The estimated cost per click for 'data visualization' is $7.11 and the ad market has low competition, meaning not many advertisers are using paid ads to target this keyword.
Monthly search volume
49,500
Competition
1,384
Cost per click
$7.11
Keyword difficulty
12/100
Easy
'data visualization' search trend
Monthly searches
| Month | Searches |
|---|---|
| October 2025 | 60,500 |
| November 2025 | 60,500 |
| December 2025 | 49,500 |
| January 2026 | 60,500 |
| February 2026 | 49,500 |
| March 2026 | 60,500 |
| April 2026 | 49,500 |
| May 2026 | 40,500 |
| June 2026 | 40,500 |
| July 2026 | 40,500 |
| August 2026 | 40,500 |
| September 2026 | 40,500 |
How much does 'data visualization' cost on Etsy?
64 listings · USD
Search volume by country
49,500Competition by country
1,384How to rank for 'data visualization' on Etsy
Target the right market
United States leads both search demand (24%) and competition (71%) for 'data visualization', but neither is overwhelmingly dominant.
Price competitively
The price range for 'data visualization' is unusually wide — from $2.25 up to $225. The median sits at $20, which is a better benchmark than the average since the spread is so large. The most populated bracket is Under $10 (38% of listings). This mid-range pricing supports both competitive and premium approaches. Differentiate with personalization options, gift packaging, or material quality rather than price alone.
Ranking difficulty
With a difficulty score of 12/100, 'data visualization' is rated easy to rank for on Etsy. This is a rare combination — high demand with low difficulty. New listings can gain traction quickly here, so prioritize this keyword in your title and tags before competition catches up.
Optimization tips
'data visualization' is short and broad, which means Etsy will match it against a wide range of listings. Lead your title with this keyword followed by specific modifiers that describe your product — for example, pairing it with terms like 'kpi dashboard' narrows the match and helps Etsy show your listing to the right buyers. Fill your remaining tags with related variations and synonyms — Etsy treats each tag as a separate ranking opportunity. Complete every listing section (description, materials, tags) and add many high quality images and a video, as Etsy's algorithm factors listing quality into search rankings.
Optimize your Etsy listings for 'data visualization'
Generate Tags
Find the best tags to pair with 'data visualization' based on real Etsy search data
Open toolGenerate Titles
Build a click-worthy listing title that includes 'data visualization' in the right position
Open toolListing Studio
Create a complete, optimized Etsy listing around 'data visualization' from scratch
Open toolVideo Generator
Turn your 'data visualization' product photos into a listing video
Open toolTop Etsy listings for 'data visualization'
Sample of 12 results
Wooden Montessori Graph Builder Board | Maple Wood Math Toy, Data Visualization Resource
MontessoriFactory
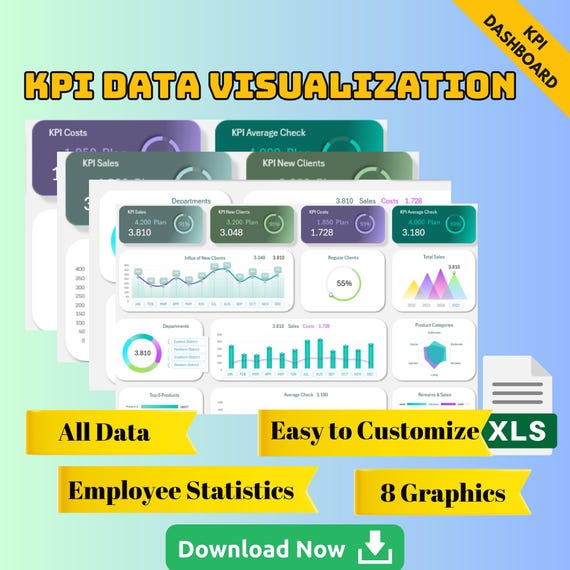
KPI Data Visualization Template for Excel Business Analytics, Visualization Tool, Metrics Graphs, Performance Metrics, Easy to Customize XLS
StudioSamharDigital

Bible Cross-References Art Print | Old and New Testament Connections | Scripture Wall Art | Data Visualization
VisioRationis
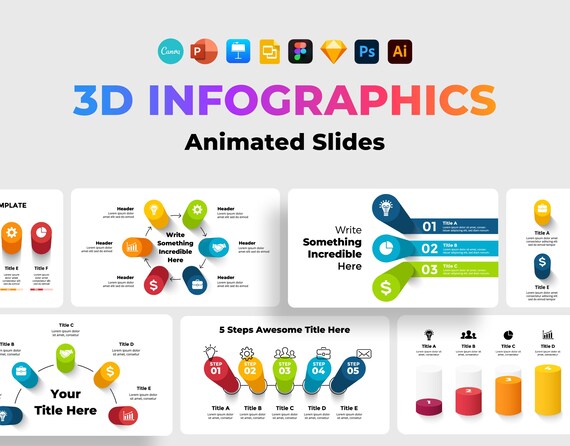
3D Infographics, Information Design, Data Visualization Graphs, Isometric Presentation Template, PowerPoint Canva Charts Diagrams
WowlyDesign
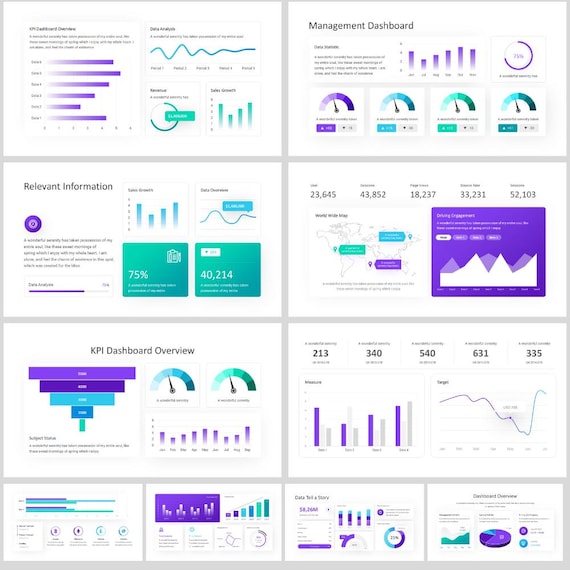
KPI Dashboard | Data Visualization PowerPoint Template | Infographics, Bar Charts, Pie Charts, Time Series, and Line Charts | 60+ Slides
NeoPackDigital

Plated Prisoner Series Goldfinch Inspired Bookmarks - Raised Gold Foil 2x8" - Data Visualization
dataandbooks
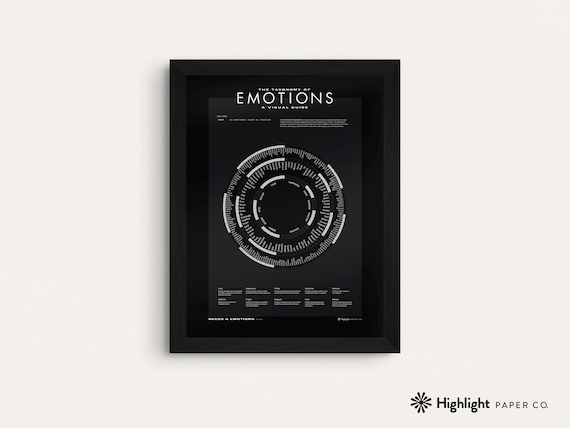
Feelings Wheel Poster (Black) — Emotion Wheel, Occupational Therapy, Large Wall Art, Data Visualization Poster, Minimalist Mancave Sign
HighlightPaperCo
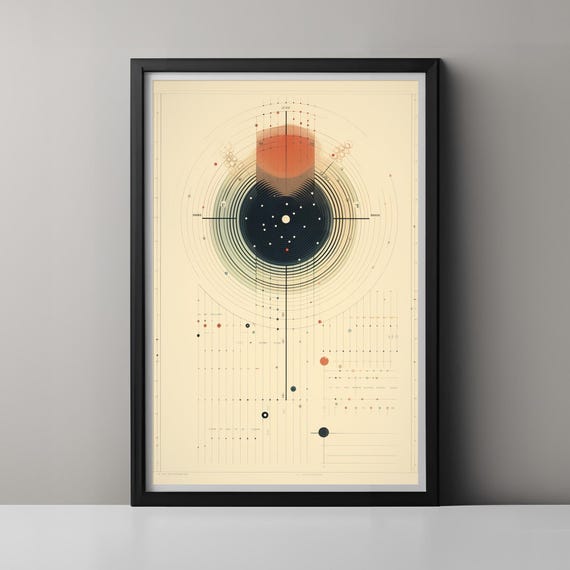
Limited Edition Data Visualization Art Print, for Gallery, Home, or Office Wall Decor
FromPointsUnknown
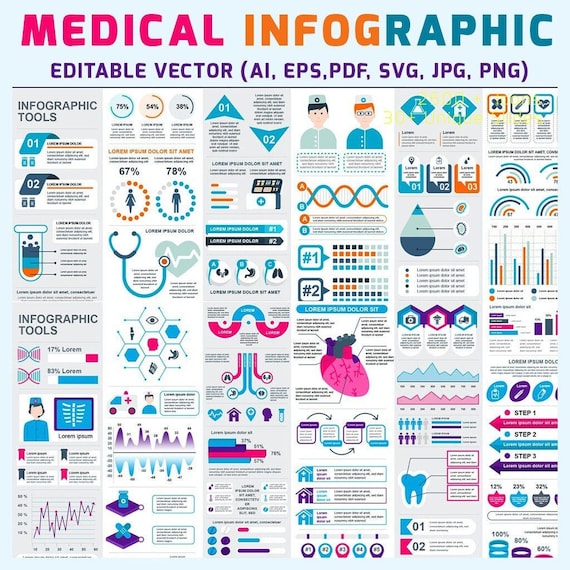
Medical Infographic Elements Data Visualization Vector Design Editable Template
BusinesTemplate
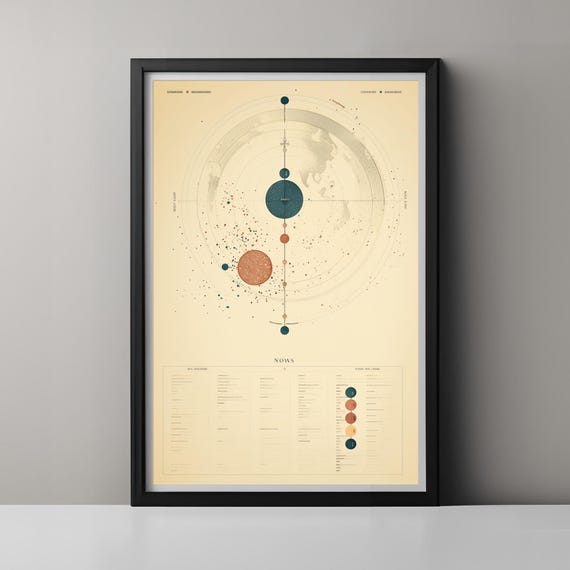
AI Data Visualization Art Print, Retro Planetary Diagram, Living Room Decor
FromPointsUnknown
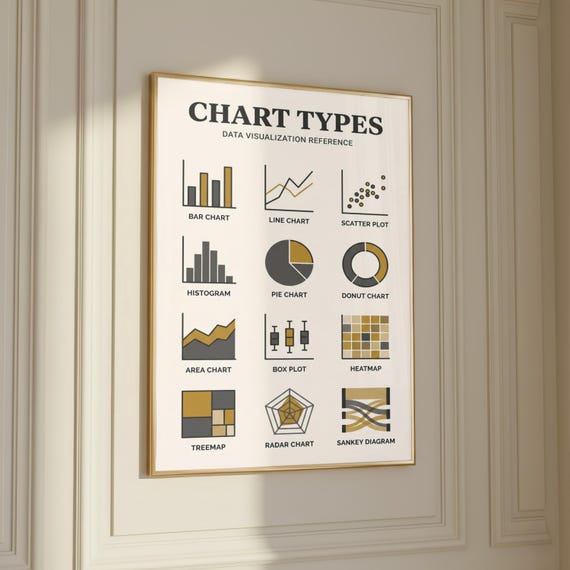
Chart Types Diagram | Data Visualization | Business Infographic | Analytic Poster Wall | Minimalist Graphic | Statistics Canvas Art
SusuHomeDecor
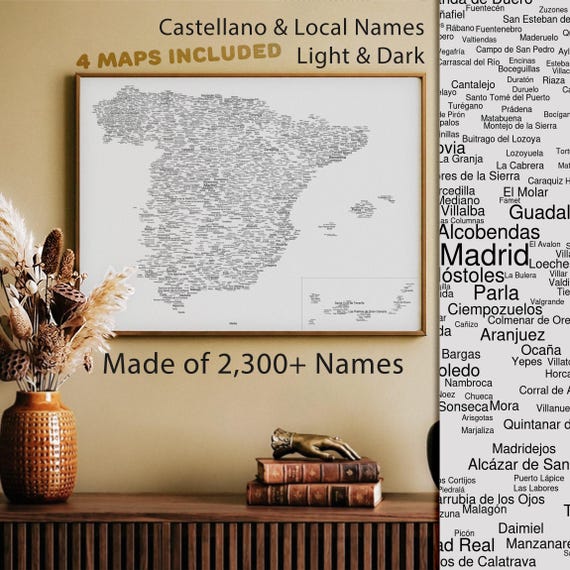
Spain Map of Names (2,300+ Towns & Villages) | Mapa de España, Data Visualization Art
LitaraMaps
Frequently asked questions about 'data visualization'
How much search demand does 'data visualization' get?
'data visualization' receives 49,500 monthly searches globally. That's strong demand without overwhelming competition, which is an attractive combination for sellers.
How saturated is the market for 'data visualization'?
There are 1,384 Etsy listings competing for 'data visualization'. Relative to the search demand, that's low saturation. Well-optimized listings can rank on the first page without needing an extensive sales history — this is the kind of keyword where newer shops can gain a foothold.
Is 'data visualization' worth targeting for my Etsy shop?
'data visualization' has a keyword difficulty of 12/100 (easy). The low difficulty makes it accessible for shops of all sizes. Even without extensive reviews, you can rank well with a properly optimized listing.
What should I charge for 'data visualization' products?
Prices for 'data visualization' products range from $2.25 to $225. The median is $20 and the average is $34. The gap between average and median tells you there are outliers pulling the average up — the median is a more reliable benchmark for what most buyers actually pay. 38% of listings fall in the Under $10 range, which is where most buyer expectations are set.
Which countries have the most demand for 'data visualization'?
United States generates 24% of searches for 'data visualization'.
How do I get my listing to rank for 'data visualization'?
Since 'data visualization' is a broad, short keyword, Etsy will match it against thousands of listings. Your title needs to lead with this keyword followed by descriptive modifiers that signal exactly what you sell. Given the low difficulty, a complete listing with good photos and all 13 tags filled should be enough to reach the first page. Focus on getting your first few sales and reviews to lock in your position. Good supporting tags to use alongside 'data visualization' include 'kpi dashboard' and 'data analysis'.
How commercially valuable is 'data visualization'?
The cost per click for 'data visualization' is $7.11. Low advertiser activity combined with low organic competition suggests this keyword may be overlooked by larger sellers. That's often where the best opportunities are — less noise, more targeted buyers.
Is 'data visualization' seasonal or trending?
Search volume dropped 33% between October 2025 and September 2026. Demand peaked around October 2025, which may indicate seasonal patterns. Check whether this dip repeats annually — if so, plan your inventory and listing renewals to go live before the next peak.
Keywords related to 'data visualization'
Tags
Materials
Ready to stand out?
Join 500,000+ Etsy sellers growing with RankHero.
Start freeNo credit card required